CODE – Center for Orbit Determination in Europe, Bern, Switzerland
ESA – European Space Agency, Darmstadt, Germany
JPL – Jet Propulsion Laboratory, Pasadena, California, USA
UPC – Universitat Politècnica de Catalunya, Barcelona, Spain
CAS – Chinese Academy of Sciences, Beijing, China
WHU – Wuhan University, Wuhan, China
NRCan – Natural Resources Canada, Ottawa, Canada
DGFI-TUM – Deutsches Geodätisches Forschungsinstitut – Technische Universität München, Munich, Germany
UWM – University of Warmia and Mazury, Olsztyn, Poland
The Fig. 1 shows the details of data flow required to generate the IGS VTEC maps from IGS ground network by IGS Ionosphere Analysis Centers, IGS Ionosphere Combination Center, IGS Ionosphere Validation Centers to final and rapid IGS Ionospere products.
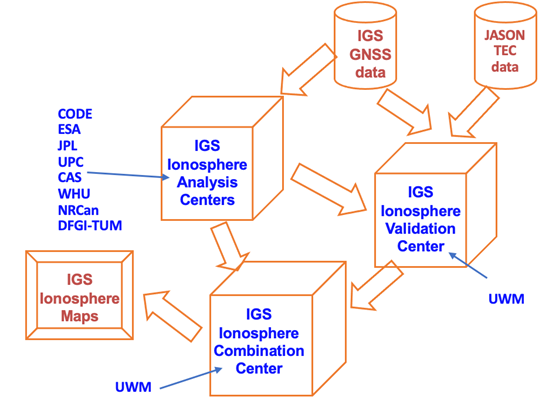
Fig.1 The data flow required to generate the IGS VTEC maps.
In order to assign the individual weights to different IAAC GIMs and compute the combined IGS GIM, the self-consistency test (see Orus et al. (2005), Orus et al. (2007) for details) is employed. The test measures the capability of a certain model to reproduce the differences of the ionospheric carrier phase observable (LI) over a single station as a function of the elevation of the satellites in view. Such differences are done guaranteeing a minimum time span between consecutive samples in such a way that just rising and setting up satellite observations, with the same elevations and without any intermediate cycle slip (i.e., within a continuous arch of carrier phase measurements) are involved. In fact, it is a measure of difference of the slant TEC (STEC), computed from the VTEC map as described by Feltens and Schaer (1998), at two different epochs in a continuous carrier phase arc. Thus, with this difference, the ambiguity term (BI) of the observed carrier phase data is removed, providing an ionospheric reference value better than one tenth of TECU. Thus the RMS (RMSself) of this test can be computed as follows:
RMSself=RMS[LI(εt1) – STECModel(εt1)-(LI(εt2) – STECModel(εt2)]
where LI is the ionospheric geometry-free combination of GPS carrier phases; the STEC is the slant TEC of the different ionospheric models; RMSself is the RMS of the difference among the LI observations and the STEC predictions at the same elevation ε in a continuous arc taking this difference at two different times, for instance, t1 and t2.
The combined IGS maps are obtained as a simple weighted mean of the available IAAC VTEC maps, by using the values obtained in the evaluation process.
The validation is held by comparing GIMs with two reference sources:
- GNSS-observed STEC values – in a same manner as during evaluation step
- Alitmeter-derived VTEC values collected with JASON mission satellites.
The comparison with direct VTEC measurements provided by dual-frequency altimeters (taken in slightly different frequency bands than GNSS, and with a typical measurement error standard deviation after smoothing of about 1 TECU). This reference VTEC is obtained up to the height of the altimeters (typically +1300 km) which includes the full ionosphere and the most contribution of the plasmaspheric electron content. The noise of the altimeter measurements can be significantly reduced by a sliding window. Moreover, comparing the altimeter VTEC vs VTEC GIM, the missing altimeter-topside electron content is just a small part of plasmaspheric component (above +1300 km and typically up to few TECUs only). Due to the altimeter calibration bias and the topside electron content above the altimeter height, the standard deviation of the difference of VTEC[altimeter]-VTEC[GIM] is the main figure of merit typically consider in this kind of assessment. Finally, the well-know altimeter bias excess (see Azpilicueta and Brunini 2009) presents a value of few TECUs only in such a way that it still allows a very clear assessment and comparison of the errors of the different ionospheric models (considering, for instance, daily statistics), typically much larger and systematic. This is the reason why the dual-frequency altimeter measurements provide an excellent and independent source for assessing GNSS-based VTEC models in difficult conditions, overseas and typically far from receivers (see for example Hernández-Pajares 2004; Orús et al. 2005; Hernández-Pajares et al. 2009, 2016).
The discrepancies of all available IGS VTEC GIMs versus + 190 millions of altimeter direct VTEC measurements over the seas during the last 15 years have been analyzed. In Fig. 2, two sets of GIMs have been compared:
- Set#1 with the IAAC contributing to IGS since 1998.4 (CODE, ESA, JPL and UPC), the recent GIM from UPC (UQRG) and the IGS combined GIM (IGSG).
- Set#2 with the new IAAC contributing to IGS (CAS, WHU, NRCAN) or resuming their contribution UQRG and IGSG.
An overall general agreement is found between the techniques of the seven analysis centers, with VTEC daily standard deviations typically ranging from three to ten TECUs, depending on the solar cycle phase.
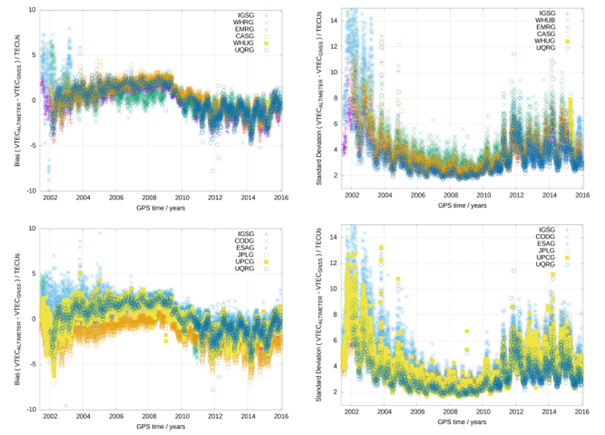
Fig. 2 Daily bias and corresponding standard deviation obtained from validation of different GIMs with JASON satellite VTEC observation(Roma-Dollase et al., 2018).
The evaluation and combination methodology as well as validation results are described in detail by Orus et al. (2007), Hernandez-Pajares et al. (2009 and 2017) and Roma-Dollase et al. (2018).